Periodic EEG features in light sleep and propofol sedation
Frederic von Wegner, Milena Wiemers, Gesine Hermann, Inken Tödt, Enzo Tagliazucchi, Helmut Laufs

DFG project: Objective EEG bed side assessment of impaired consciousness in epilepsy
DGKN 2023
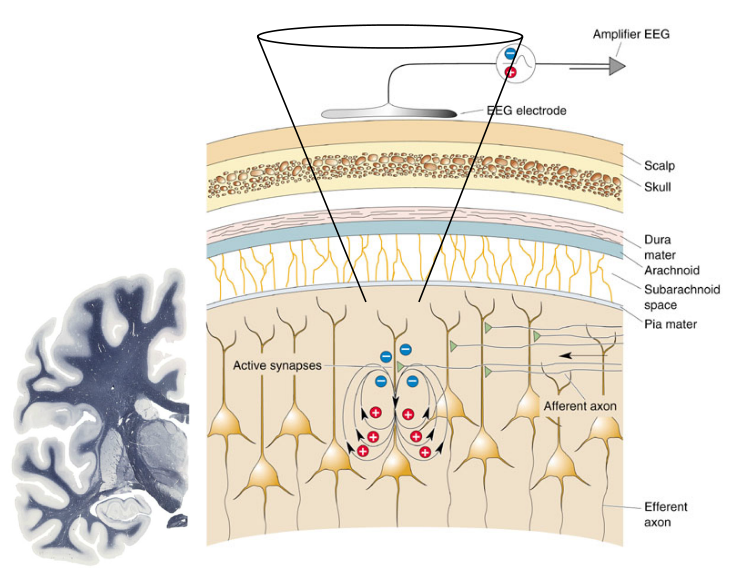
EEG basics

EEG background
Motivation

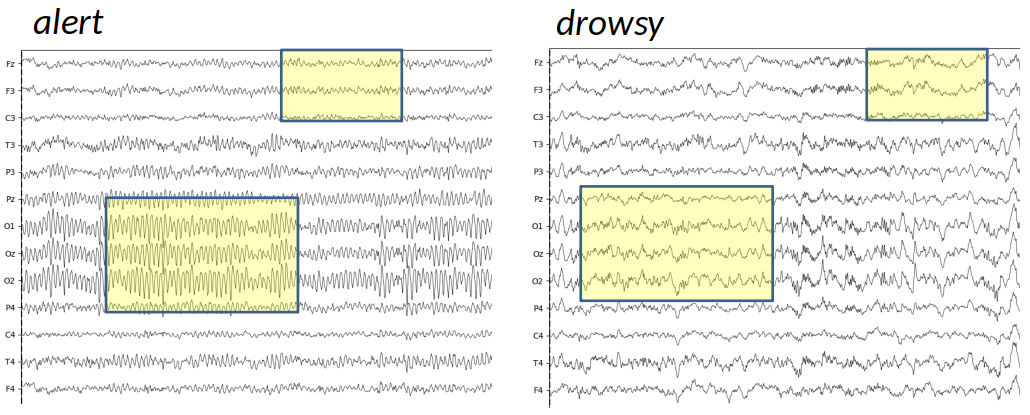
Example-1
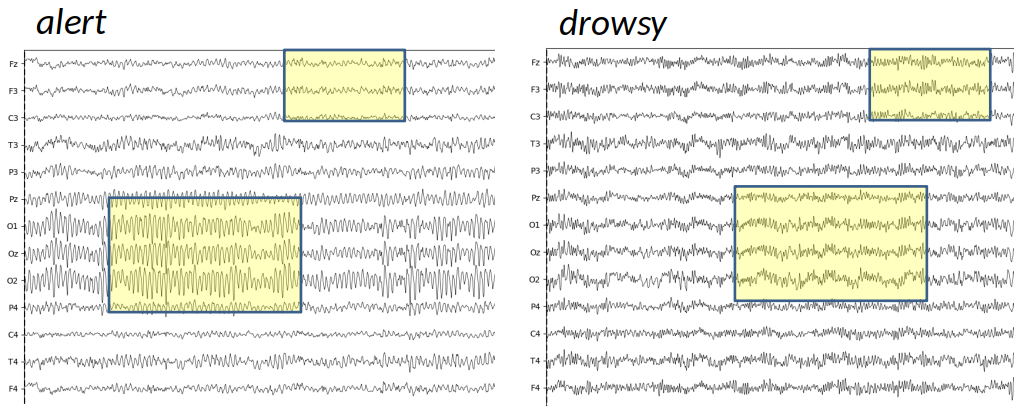
Example-2
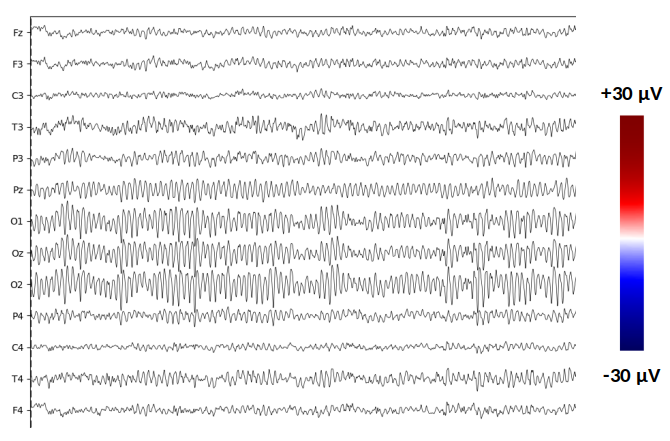
Preliminary observations
Data sets
Main questions
- Is EEG activity periodic at the global (scalp-wide) level?
- Is periodicity a marker of reduced vigilance (consciousness) ?
EEG microstates (Lehmann, 1972)
How to summarize spatio-temporal information?
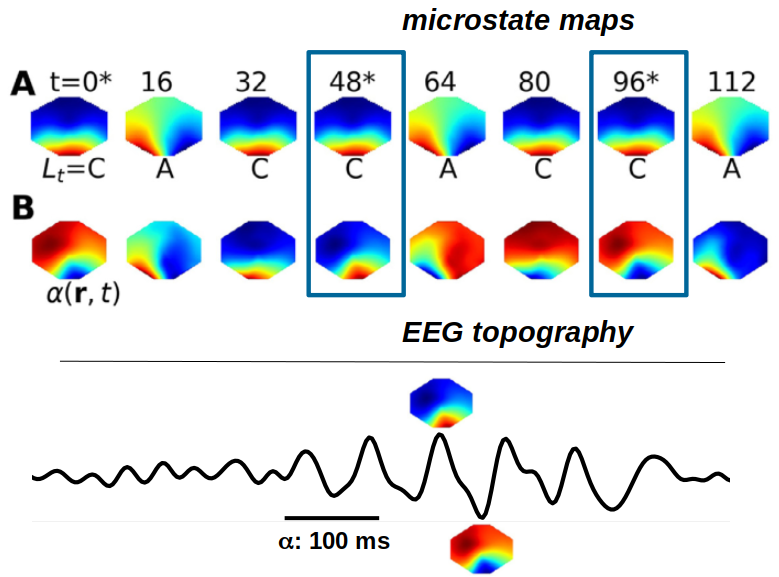
Step 1: Microstate maps
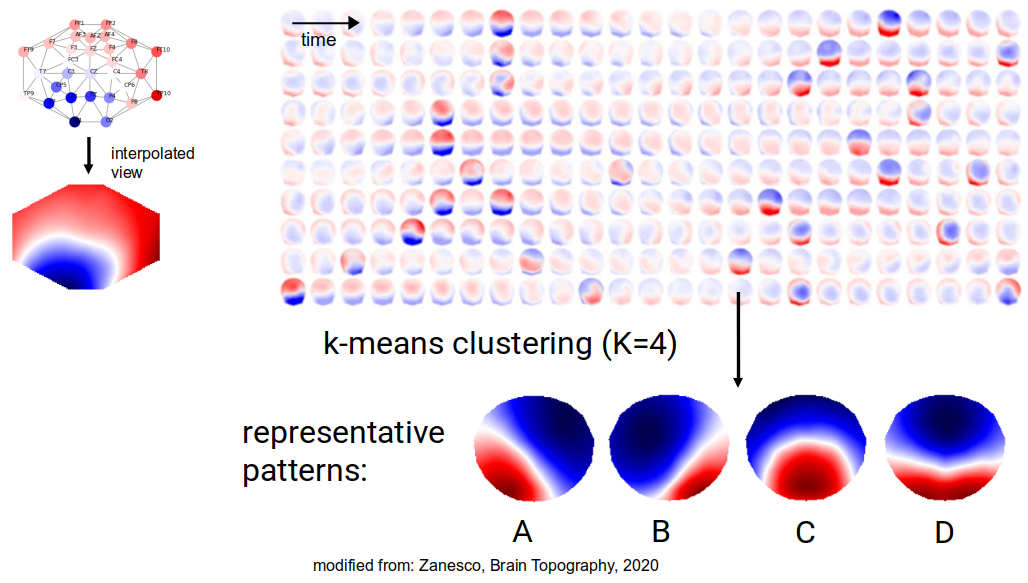
Step 2: Microstate sequence

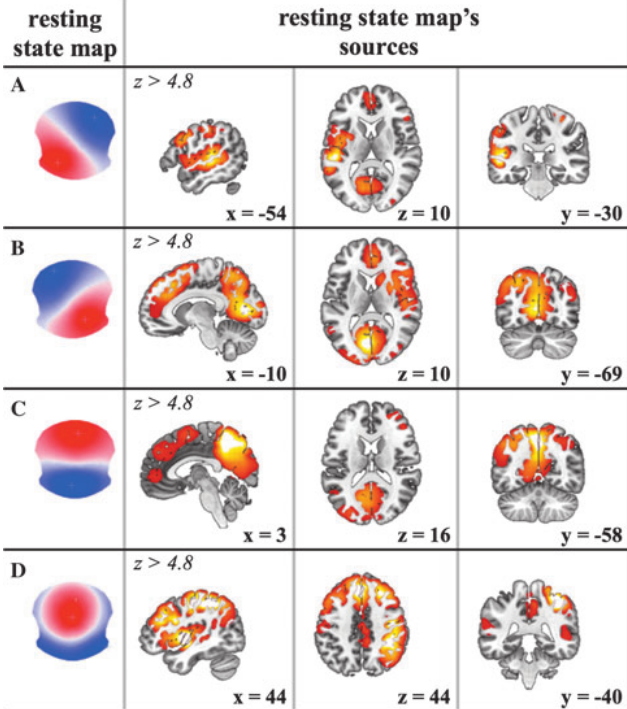
EEG microstates and brain networks
Microstates and data compression
- Initial data set: 30 channels x 16 bit (for instance)
- Microstate sequence: single letter (A...D) = 2 bit
- Compression factor: 240
- Question: can this (0.4%) encode enough information to capture subtle differences in alertness?
Analysis-1 (von Wegner, 2017)
Analysis-2 (von Wegner, in prep.)
Comment
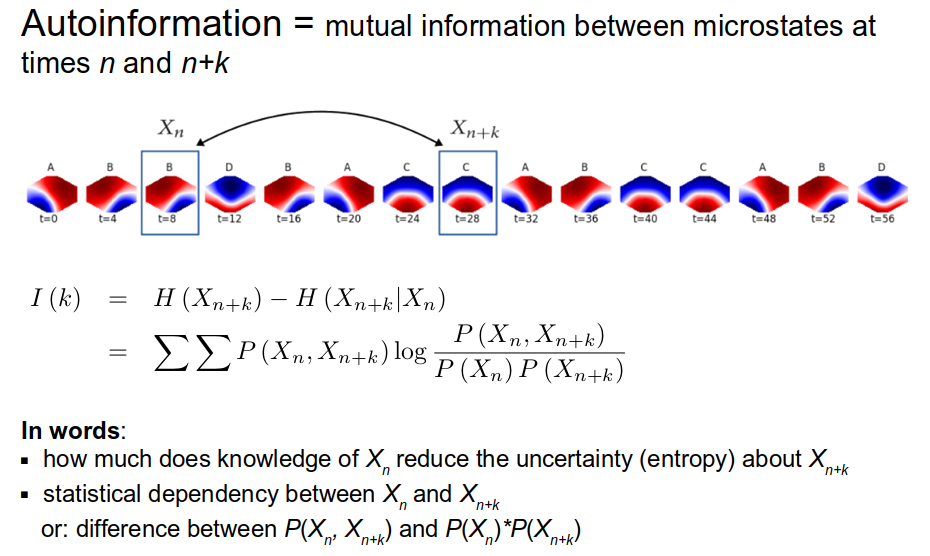
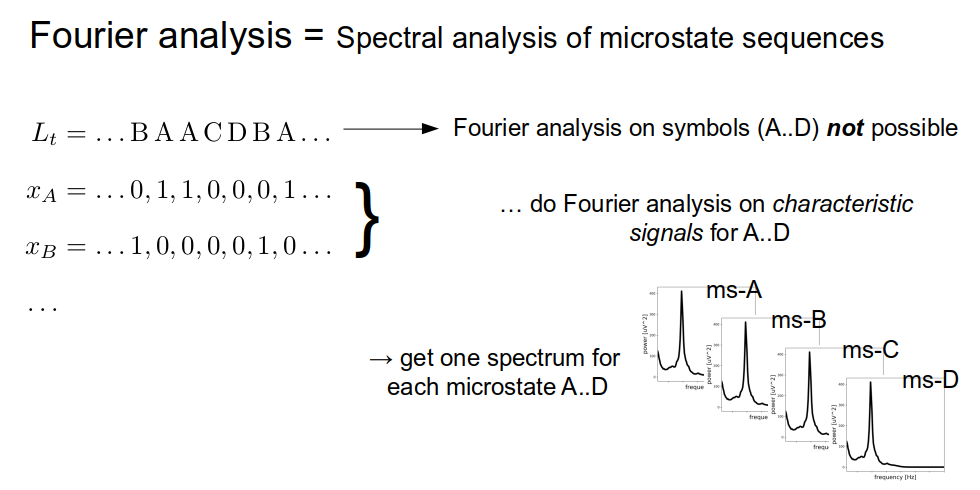
Wiener-Khintchine theorem

Previous results
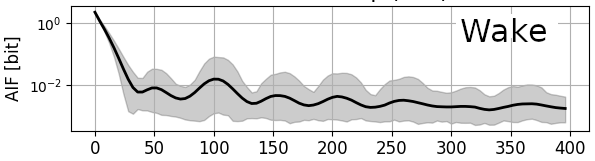
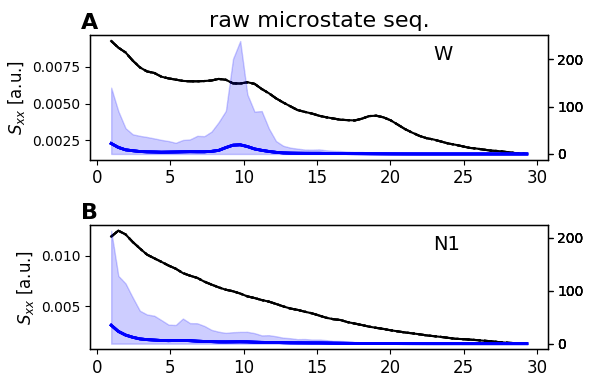
Frequency doubling
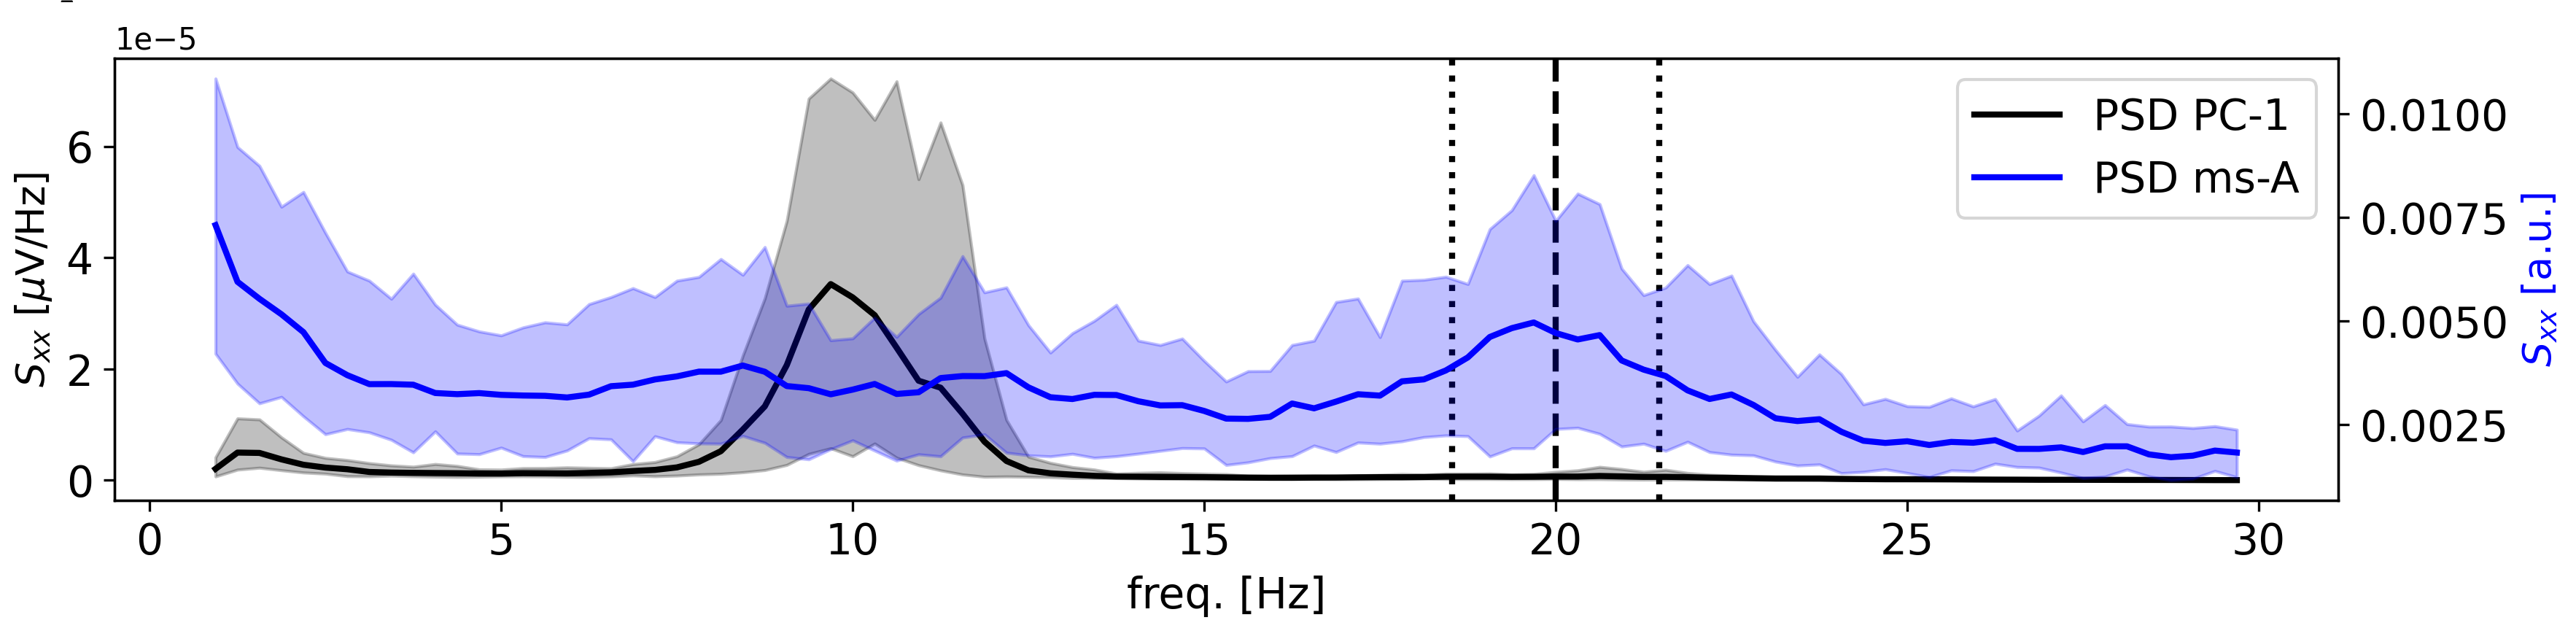
Results
Question:
Loss of consciousness - loss of topography?
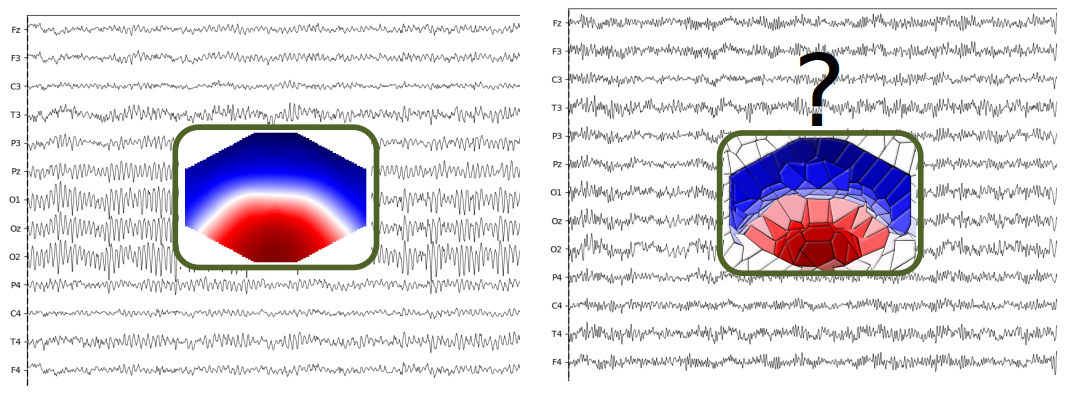
Results
Microstate maps in reduced consciousness


Surprise:
Microstate maps don't change much in sleep and propofol sedation.
Results
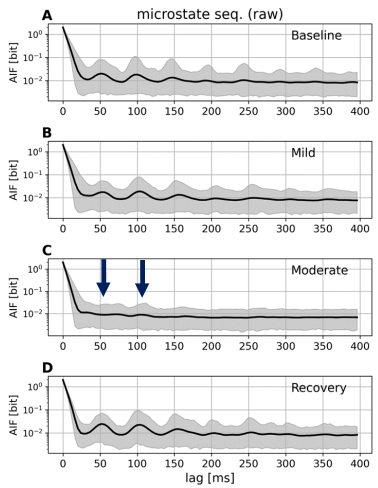
Results
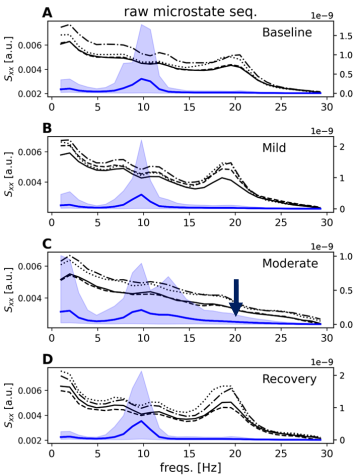
Results

Results
Results
Conclusions
- EEG microstate sequences capture spatial (topographic) and temporal characteristics simultaneously
- EEG patterns occur periodically, closely linked to the individual's alpha frequency during wakefulness (explain frequency doubling?)
- Loss of periodicity as a common feature of reduced consciousness in light sleep and propofol sedation
- Single electrode level is not a good predictor of global synchrony (propofol, moderate sedation)
- In the analyzed conditions, periodic, coherent scalp-wide EEG patterns are a signature of intact vigilance (awareness, consciousness)
Explanations & Outlook
- EEG - biophysical models - coupled oscillators
- Coupled oscillators close to criticality produce coherent but changing patterns, leading to 'global patterns'
- Microstates represent momentarily phase-coupled oscillator populations
- Loss of consciousness - loss of critical coupling
- Role of information processing and sharing across brain regions
Thank you!
This project is a collaborative effort funded by the DFG
- Helmut Laufs
- Gesine Hermann
- Inken Toedt
- Enzo Tagliazucchi
- Frederic von Wegner (f.vonwegner@unsw.edu.au)